
Study Site
This study was conducted during the summer of 2013 on the islands and mainland of Lac La Ronge, north-central Saskatchewan, Canada (55°06’ N, 105°01’ W). The 1,305 islands of Lac La Ronge were formed during the retreat of the Laurentide ice sheet and provide a range of island sizes (0.3-500+ ha) and isolation suitable for island biogeographical questions. The beginning of the Canadian Shield intersects the lake and most of the islands are found in the central to northern reaches. The scouring of the retreating ice sheet created islands that are long and similar in shape, running south-west to north-east.
Lake islands are in green and mainland is in white. Black circles indicate island study sites and labels refer to waypoint IDs. In total, 30 islands a 5 mainland sites were sampled.
Methods
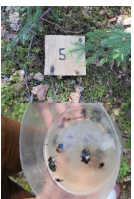
Carabid beetles were collected using pitfall traps constructed from 1 L round plastic containers with a tight fitting 0.5 L inner cup (Spence & Niemelä 1994). Traps were placed in the ground so the lip of the container was flush with the substrate. An opaque lid (15 x 15 cm) was suspended 2-3 cm above the trap to prevent debris and excess rainwater from clogging the trap (Work et al. 2002). Each site contained 8 pitfall traps distributed along a transect at 15 m interval (Digweed et al. 1995). Traps were run continuously from 2 June to 23 August and were emptied ca. 14-17-day intervals (weather pending) and filled each time with 2-3 cm of propylene glycol. Samples were stored in 90% EtOH and identified to species based on Lindroth (1969). Wing type and sex were also recorded.
Carabid beetles were collected using pitfall traps constructed from 1 L round plastic containers with a tight fitting 0.5 L inner cup (Spence & Niemelä 1994). Traps were placed in the ground so the lip of the container was flush with the substrate. An opaque lid (15 x 15 cm) was suspended 2-3 cm above the trap to prevent debris and excess rainwater from clogging the trap (Work et al. 2002). Each site contained 8 pitfall traps distributed along a transect at 15 m interval (Digweed et al. 1995). Traps were run continuously from 2 June to 23 August and were emptied ca. 14-17-day intervals (weather pending) and filled each time with 2-3 cm of propylene glycol. Samples were stored in 90% EtOH and identified to species based on Lindroth (1969). Wing type and sex were also recorded.
 Line-intercept method
A 120 m line-intercept was performed along the pitfall transect to characterize the vertical habitat structure and canopy. The start and end-point of each species intercepting the transect was recorded and used to estimate species-specific cover. The vertical structure was separated into 3 categories (tree, shrub, regeneration). The tree layer contained any woody stems ≥ 1 m height and ≥ 4.5 cm diameter breast height (DBH). Shrubs were any wood material < 4.5 cm DBH and regeneration corresponded to any woody material < 1 m height. Plants were identified to lowest taxonomic rank and recorded to the nearest 0.1 m. The size and decay class of all downed trees (≥ 7 cm, < 50 % buried) intersecting the transect was recorded.


Statistical Analysis
Non-metric multidimensional scaling (NMDS) was performed using the ecodist (Goslee & Urban 2007) and vegan (Oksanen et al. 2013) packages in R (version 3.0.2, The Foundation for Statistical Computing Platform 2013). I chose Bray-Curtis distance for my dissimilarity matrix because it is well known for its use with ecological abundance data, and suitable for my % tree cover estimates.
In an NMDS, the distances calculated in the dissimilarity matrix are ranked and represented in a reduced-dimensional ordination. Stress is a measure of how well the ordination represents the original distances calculated in the dissimilarity matrix. Typically, as you include more dimensions in the ordination, the stress value decreases. However, inclusion of more dimensions often makes the ordination harder to interpret. In the carabid community ordination (Results), I chose two dimensions with a stress value of 0.138 in favor of interpretability, rather than adding a third dimension with a stress value of 0.09. Selection of a stress limit between 0.10 and 0.20 allows for adequate representation of two dimensional NMDS solutions, yet optimal solutions for the overall structure are achieved as stress values approach 0.10 (Clarke & Warwick 2001). After creating the carabid species abundance ordination, I then used the env.fit function in the vegan package to overlay some of the environmental data I collected (vectors).
Disclaimer
This website was created as part a class project for RenR 690 at the University of Alberta. Any results discussed are preliminary and may be based on modified data sets. Please contact the author for more information.
This website was created as part a class project for RenR 690 at the University of Alberta. Any results discussed are preliminary and may be based on modified data sets. Please contact the author for more information.
